
Before you switch BI tools, read this
Why slow dashboards are usually a data modelling problem, and what that means before you sign with a new BI vendor.

There’s a specific moment in a company’s data life that nobody puts in a board deck. It’s the moment the sales team quietly stops opening the dashboard.
No announcement, no ticket, no angry Slack thread. Someone waits 40 seconds for a filtered view, gets a timeout, shrugs, and pings the finance analyst instead: “hey, can you just pull me Q3 by region?”
Two weeks later that’s the process. Six weeks later the finance analyst is spending five to eight hours a week on requests that a dashboard was supposed to have eliminated. The dashboard is still there, technically working, opened by nobody, with three months of build time and a licensing contract behind it.
At Valiotti Data we walked into exactly this at a materials supplier in construction and landscaping. Thousands of orders a day, hundreds of SKUs, multiple warehouses, three customer segments that behave nothing like each other. Their Power BI dashboards took 30+ seconds to load. Complex filters (region × product category × time period, which is the only way anyone actually looks at this business) timed out.
The ask that came to us was to rebuild everything in Metabase. We did end up doing that, but for very different reasons than the ones in the brief.

The migration trap
When a dashboard gets slow, the story a team tells itself is usually about the tool. Power BI can’t handle our volume. Tableau’s too rigid. Looker’s too expensive. Let’s move.
It’s an appealing story because you can act on it immediately. You can buy your way out of a tool problem, put it on a roadmap, hand it to a vendor.
What was actually happening had very little to do with Power BI. Those dashboards were designed when the business was smaller, and nobody re-optimised the data layer as volume grew. Every filter click fired a query that scanned far more than it needed to. Occasional slowness compounded quietly into permanent slowness over a couple of years.
Move that unchanged into Metabase and you hit the same wall in a different colour. It runs beautifully for a quarter, because everyone’s excited and nobody’s stress-testing it yet. Then the 30-second loads come back, and by then you’ve spent the political capital you would have needed to fix the real problem.
Slow dashboards are almost always a symptom of something further upstream.
What we actually did
Four steps. The order mattered more than any individual step.
1. Audited before touching anything.
We inventoried every existing dashboard and documented the business logic, calculations, filters, and usage patterns behind each one. Which views got opened daily? Which got built once for a board meeting in 2023 and never again?
This is the step teams skip, and it’s the one that pays for itself fastest. A migration is the cheapest moment you will ever have to delete things. Half of what sits in a mature BI instance is dead weight that nobody has the standing to remove. During a migration, you have that standing.
2. Fixed the data layer.
This is the whole engagement in one line. Instead of replicating the Power BI dashboards in Metabase, we rebuilt the models underneath them: pre-aggregated tables for common query patterns, proper indexing, a data layer designed specifically for the query engine that would be hitting it.
A faithful copy-paste would have handed the client the same problem with a new logo on it, after a full migration budget.
3. Rebuilt with the analysts in the room.
We ran testing sessions with the actual humans, meaning sales reps, financial analysts, and managers, before the full rollout. These weren’t demos. People tried to answer their real Monday-morning questions while we watched where they got stuck.
Every usability problem we caught there would otherwise have surfaced three weeks after launch, as a reason not to trust the new thing.
4. Went past the brief.
Once the data layer was sound, capabilities that had been infeasible became cheap. So we added three that never existed in Power BI:
Purchase frequency analysis, flagging at-risk accounts by declining order patterns before the churn shows up in revenue
Product affinity, showing which SKUs get bought together, which translates directly into cross-sell logic
Seasonal demand forecasting, combining historical sales with industry seasonality
None of this was in the original scope. All of it was nearly free once the foundation was right. That’s a reliable signal of a healthy data project: the second wave of value costs a fraction of the first.
Results
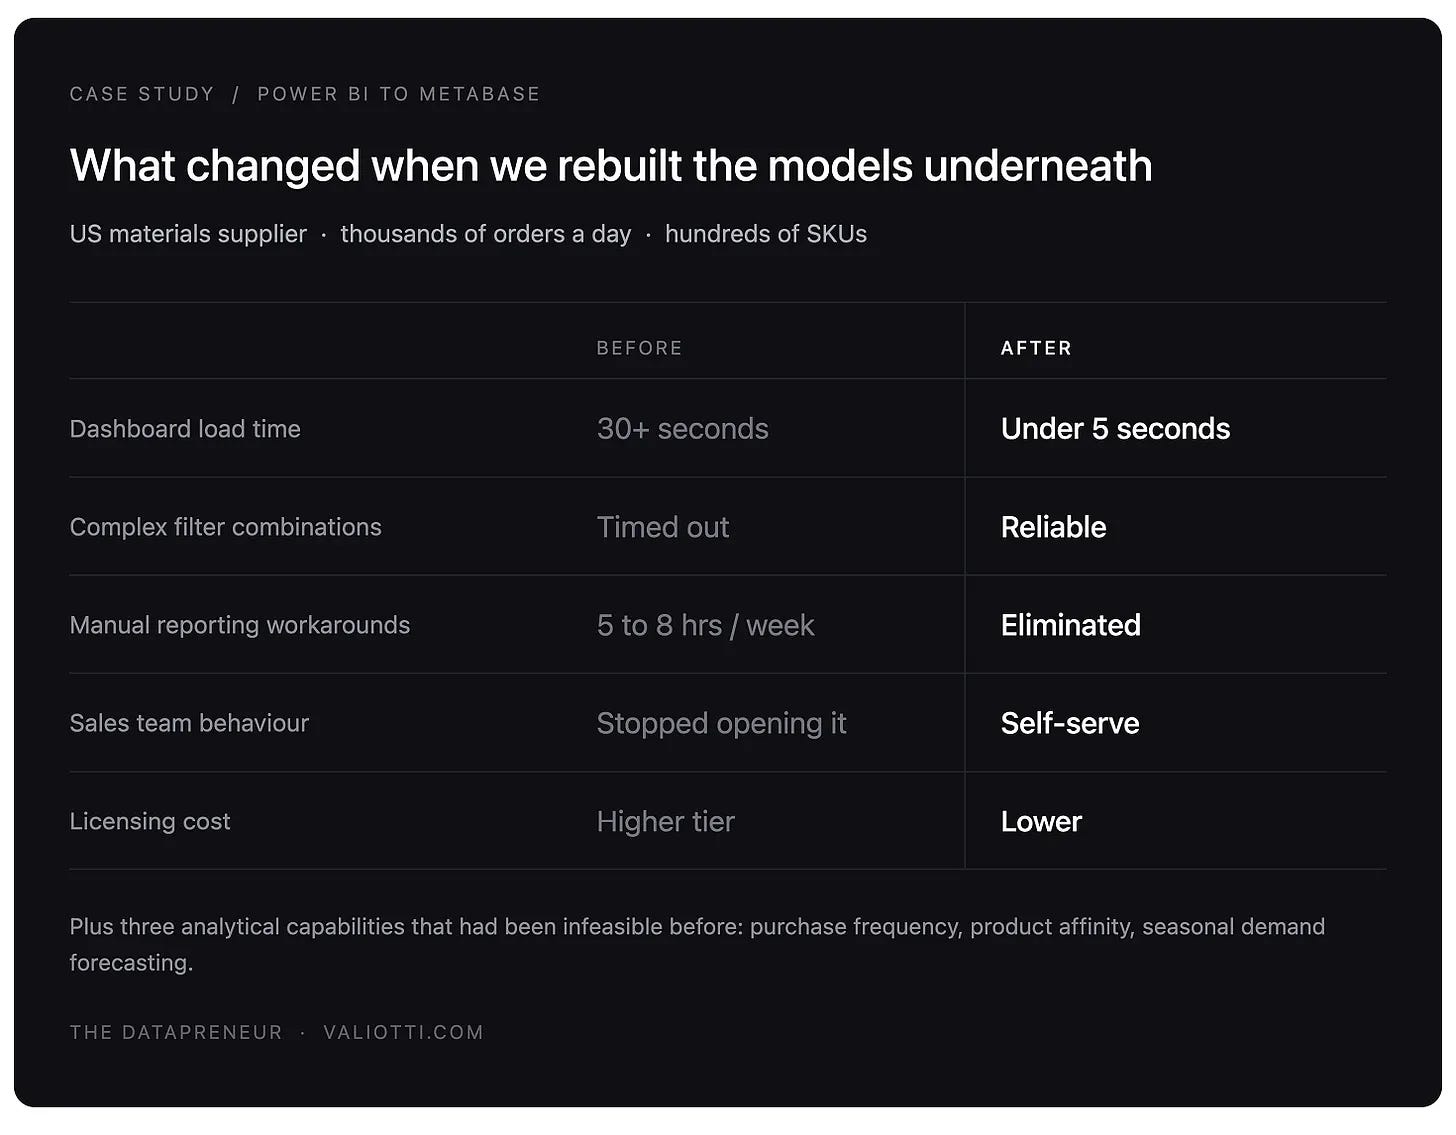
Load times went from 30+ seconds to under 5, roughly 6x faster
No more timeouts on complex filter combinations
5 to 8 hours a week of manual reporting workarounds eliminated
Lower licensing costs, since Metabase’s pricing model suited this organisation’s scale better
Embedded documentation (tooltips, definitions, methodology notes) so a new hire can understand the numbers without booking a training session
That last one is underrated. Undocumented dashboards start decaying the moment the person who built them changes jobs. Documentation is what keeps a dashboard useful after its author has moved on.
3 things to take with you
Treat a migration as a redesign. A faithful port carries every accumulated flaw across to the new platform at full price. If nobody on the project is willing to rethink the models underneath, the budget gets spent and the problem stays.
Check the modelling before you check the vendor list. Have someone look at what your existing queries are actually doing. A surprising number of “we need a new BI tool” conversations end with a decision to add three aggregate tables instead, and no vendor is going to volunteer that.
Measure adoption, not just uptime. Pull the usage logs and look at whether anyone opens the thing. If the sales team stopped logging in four months ago and started DMing an analyst, you’re carrying an invisible headcount cost that nobody has priced.
Where this usually sits on the map

Most companies I work with at $3-10M ARR are stuck in a specific month of the same story. The dashboard nobody opens is one of the more common ones, and it’s usually a late symptom of a data foundation that grew by accretion rather than by design.
I made a 3-minute read that describes your data setup without seeing it. One framework, and a real case: how a $6M marketplace went from data chaos to a 12-month roadmap in four weeks.
Nick, I've been preaching this for years. My favorite story about this is how Qlik used to train. Was a 3-4 day training, and the first half of the training was all about data layers and data modeling, before making your first chart or dashboard.
After that experience, joining other companies and watching dashboards flop/lag/freeze after a few dozen users, with dashboard developers treating PBI and Tableau workbooks like an Excel file, attempting to do everything in the visualization layer. Same with the few years in my consulting practice, seeing bloated dashboards with everything happening in the visualization layer.
Separating data/transformation layers from the visualization layer usually solves 90% of dashboard problems.