


Vanity Metrics Don’t Pay the Bills
Vol. 8: Why impressions and clicks aren’t enough — and what to track instead if you want to grow.

Welcome back to The Datapreneur — your go-to source for sharp, actionable insights on data and decision-making.
I write this newsletter for founders, operators, and analytics pros who want to cut through the noise and make smarter decisions, faster. These aren’t theories. They’re patterns I see inside real companies, after working with 50+ teams over the past 16 years.
TLDR
Most teams don’t need more dashboards — they need better questions. Vanity metrics like impressions and clicks might look nice, but they rarely drive decisions.
Try these instead:
CAC
ROAS / Marketing ROI
MQL Count
Conversion Rate by Stage
CTR
Channel LTV:CAC Ratio
Funnel Velocity
→ Build one simple overview dashboard your team can review every week.
→ Set clear ownership
→ You’re amazing!
Bonus in the summary: free 28-day roadmap to help you clean up your marketing analytics.
Vanity ≠ insight
Let’s talk about a dashboard I see in almost every startup.
→ Top: Impressions.
→ Middle: Website visits.
→ Bottom: Clicks, views, bounce rate.
And then the founder says:
“We’re not growing. What are we missing?”
The answer? Insight. Most of what you’re tracking is noise.
Vanity metrics aren’t evil. They can help with surface-level visibility, but they rarely tell you what actions to take. They’re easy to collect and even easier to misinterpret.
Take impressions. Sure, your brand was seen, but by whom? And did they convert?
Or clicks. You paid for attention, but did it lead anywhere meaningful?
Worse, some metrics are lagging. By the time ROAS dips, the underlying issue has been festering for weeks.
This is why smart teams shift away from reporting what’s visible, toward what’s actionable.
7 metrics that actually drive decisions
Here’s what I recommend instead: a focused set of metrics across your funnel that reflect acquisition, efficiency, and velocity:
Customer Acquisition Cost (CAC)
Not just ad spend — your real CAC includes team time, tools, and agency retainers. Without this, you’re flying blind.ROAS / Marketing ROI (ROMI)
Revenue is not enough. You want to know: are campaigns profitable after costs? This is how you spot where the money leaks, or compounds.MQL Count (Marketing-Qualified Leads)
Don’t celebrate lead volume unless it’s qualified. Sales teams waste time chasing noise when marketing optimizes for the wrong leads.Conversion Rate (CR) by Stage
Track drop-offs from click to close. Knowing where prospects churn helps you fix specific bottlenecks, not just guess.Click-Through Rate (CTR)
CTR is still relevant, but only if it correlates with conversion. Otherwise, you’re just optimizing for curiosity, not intent.Channel-Level LTV / CAC Ratio
Zoom in by channel. Some bring quick wins. Others bleed slowly. LTV:CAC gives you long-term sustainability insights, not just short-term dopamine.Funnel Velocity
How long does it take from first impression to sale? Long cycles don’t just delay revenue. They complicate forecasts and hide friction.
When tracked together, these metrics don’t just show what happened. They show what to do next.
What I’d do to make it work weekly
Let’s say a founder brings me in and says, “We need a dashboard to see what’s working.”
Here’s what I wouldn’t do:
Open Looker
Request 12 APIs
Start visualizing yesterday’s metrics.
Instead, I’d sit with marketing, product, and sales — and ask:
→ “What do you report to your boss every week?”
→ “What signs tell you a campaign is underperforming?”
→ “What decisions are delayed because you don’t trust the numbers?”
These conversations unlock everything.
I’d then sketch 5–7 metrics that answer those questions, and only build dashboards once we agree on definitions.
For example, here’s what we did for one of our clients at Valiotti Analytics:
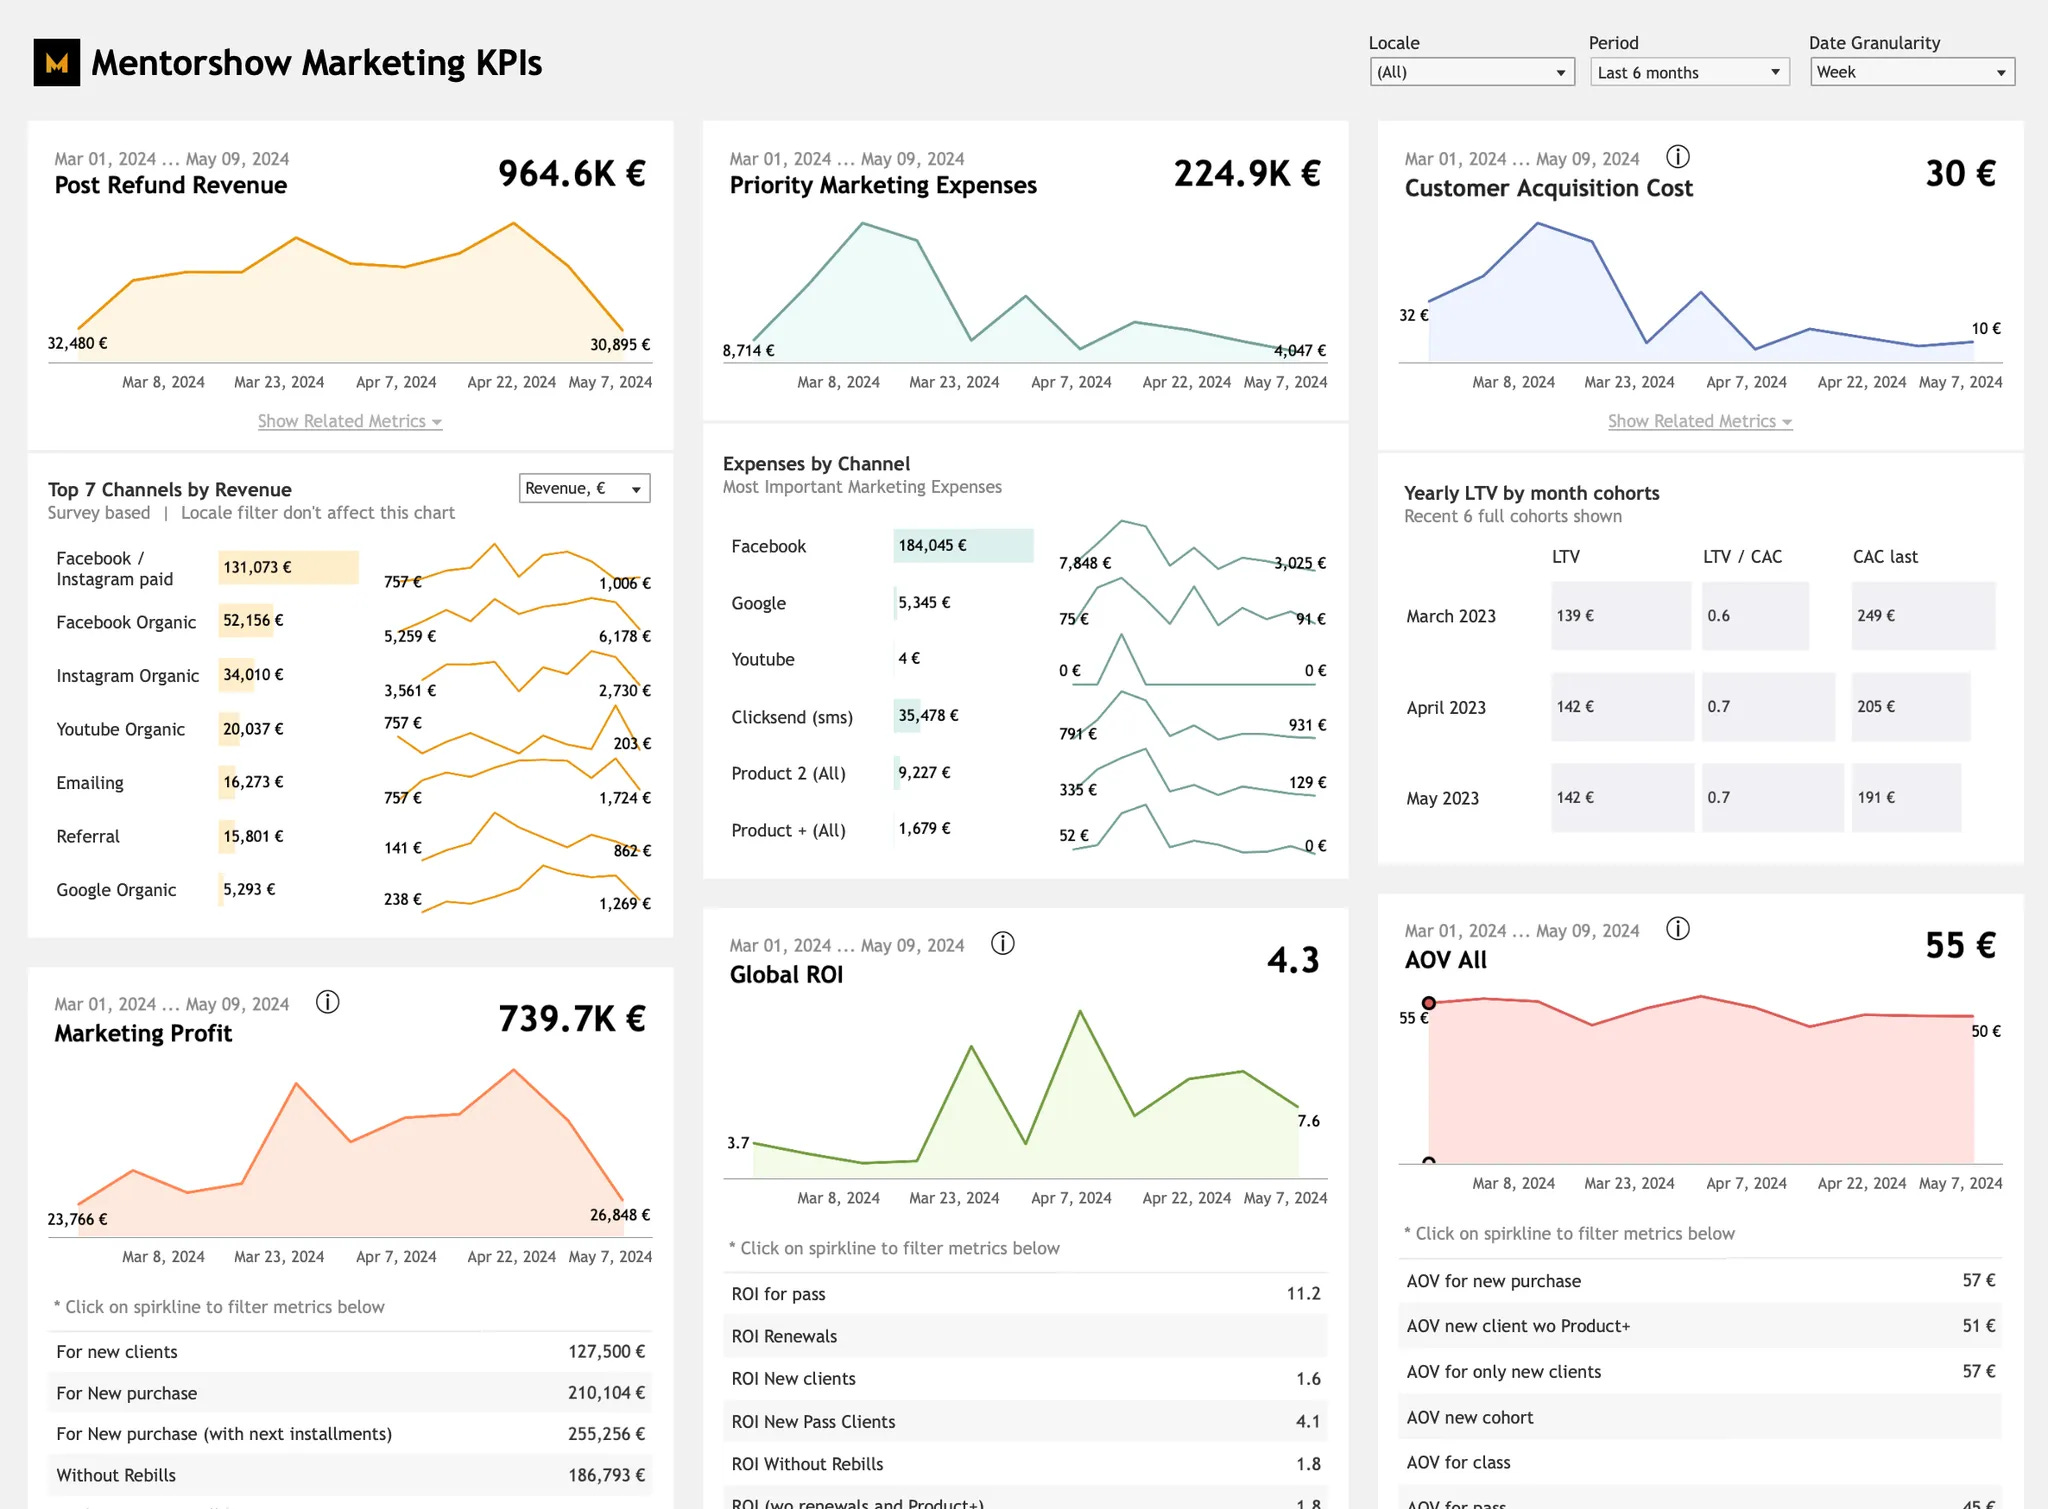
While the specific metrics in this dashboard may vary, the process behind building it was exactly the same. We spoke with the client, defined what success and failure looked like, and aligned on the key signals they needed to make informed decisions.
And just like that, this marketing dashboard was born.
Now back to the rest of the process.
→ I’d then structure a simple weekly flow:
One high-level overview to monitor CAC, ROAS, funnel drop-offs, and channel performance
Deep dives only when something breaks (e.g., a sudden spike in bad leads)
Clear ownership: usually the Head of Marketing. Not the founder. Not everyone.
Most teams don’t need more dashboards. They need aligned expectations and operationalized insights.
Final thought for founders
Your dashboard is only as good as the clarity behind it.
Stop asking, “Can we track this?”
Start asking, “What do I need to see every Monday morning to confidently steer the business?”
Most of the time, it’s just three numbers:
→ What did we spend?
→ What did we get?
→ What broke?
Define those first. Then — and only then — build your dashboard.
Pro tip
If your metrics still feel fuzzy — or your dashboards generate more debates than decisions — here’s something to help:
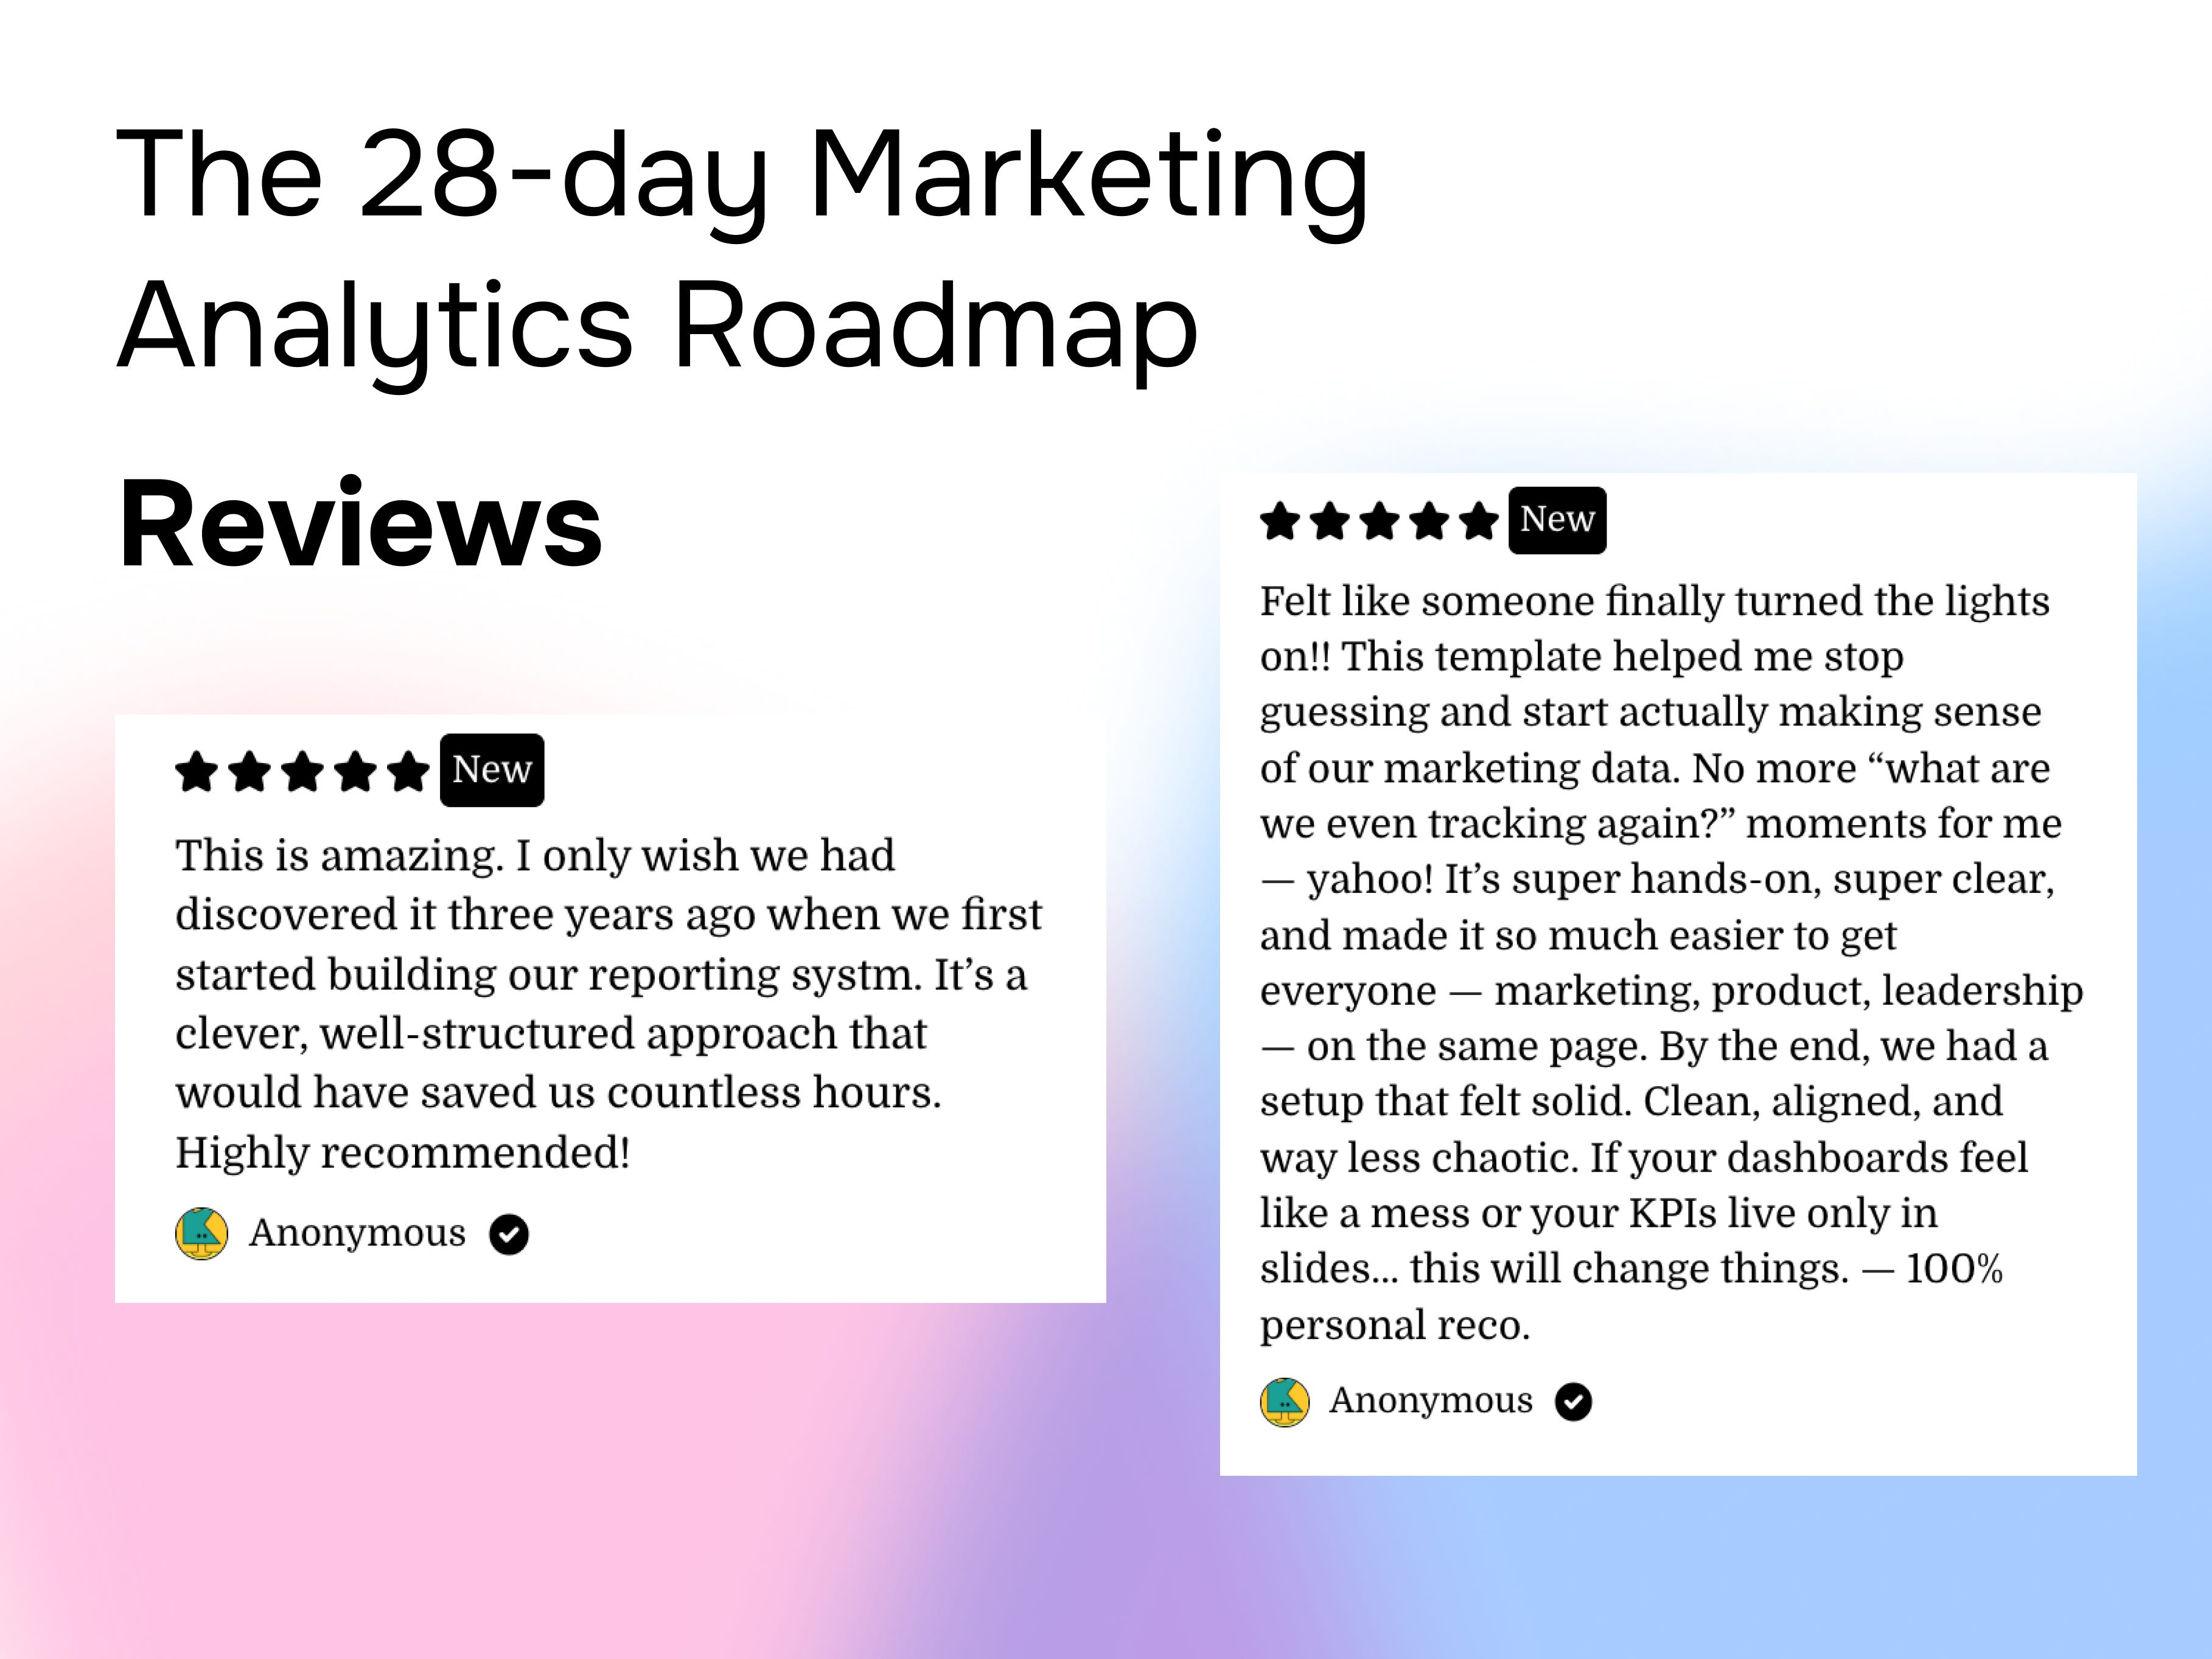
The 28-Day Marketing Analytics Roadmap
It’s the system we use internally at Valiotti Analytics with early-stage clients. You’ll get:
Notion templates
A KPI definition framework
Worksheets to turn chaos into clarity
Weekly roundup
Every week, I highlight a few standout posts that challenge how we think about data, dashboards, and decision-making. This week’s picks hit right at the heart of the issue: too many metrics, too little meaning.
1. The Game of Dashboards
Read the post →
Dashboards are everywhere — but most don’t serve anyone. A sharp (and hilarious) breakdown of how too many dashboards can look productive while masking real misalignment. Spoiler: the most powerful dashboards are the few that get used.
2. Not All Metrics Matter
Read the post →
Engagement. Activation. Sentiment. They sound impressive — but are they tied to outcomes? This post is a great reminder to anchor your analytics to real business results, not just noise.
3. Dashboard Factories Rule!!
Read the post →
A sarcastic (and sadly accurate) take on the dashboard industrial complex. If your team is churning out dashboards with no clear purpose, this post will hit home — and make you laugh.
That’s it for this week
Thanks for reading The Datapreneur — I hope this issue helps you rethink which marketing metrics actually matter, and gives you a clearer path to building a KPI system that drives real decisions.
Remember: it’s not about tracking more, but tracking better. When your metrics are aligned with your goals, growth becomes a lot less mysterious.
If you found this useful, feel free to share it with a teammate or reply with your thoughts — I always enjoy hearing what you’re working on.
See you next week with more insights to help you turn data into clarity, and clarity into momentum.
— Nick from Valiotti Analytics